KS Tech logo

Cracking the Data Code: The Ultimate Guide to the Best Data Analytics Courses in Vadodara

Introduction In today’s digital economy, data has become one of the world’s most valuable assets. Every online purchase, social media interaction, business transaction, healthcare record, and financial operation generates massive amounts of information. Organizations are now leveraging this data to make smarter decisions, improve customer experiences, optimize operations, and gain a competitive edge. This growing reliance on data has created an unprecedented demand for skilled data analysts across industries. From multinational corporations to startups, companies are actively seeking professionals who can transform raw numbers into meaningful business insights. If you’re looking to build a rewarding career in this rapidly expanding field, enrolling in the best Data Analytics Course in Vadodara can be your first step toward success. Whether you’re a student, working professional, business owner, or entrepreneur, this comprehensive guide will help you understand everything about Data Analytics, career opportunities, essential skills, salary expectations, and how to choose the right Data Analytics training institute in Vadodara. What is Data Analytics? Data Analytics is the process of collecting, cleaning, organizing, analyzing, and interpreting data to uncover patterns, trends, and valuable insights that help businesses make informed decisions. Rather than relying on guesswork, organizations use data analytics to answer critical questions such as: Data analytics transforms complex datasets into meaningful information that drives smarter business decisions. Why Data Analytics is One of the Fastest Growing Careers The world generates over 328 million terabytes of data every day, and this number continues to grow rapidly. Organizations need skilled professionals who can analyze this information and convert it into actionable strategies. Industries hiring Data Analysts include: As businesses become increasingly data-driven, the demand for qualified analysts continues to rise. Why Learn Data Analytics in Vadodara? Vadodara has evolved into one of Gujarat’s fastest-growing educational and industrial hubs. The city is home to numerous IT companies, manufacturing industries, startups, and multinational organizations that require data-driven decision-making. Advantages of studying Data Analytics in Vadodara include: Students can build job-ready skills without relocating to cities like Bangalore, Pune, or Hyderabad. Skills You’ll Learn in a Data Analytics Course A professional Data Analytics Training program should cover both technical and analytical skills. Microsoft Excel Excel remains one of the most widely used analytics tools. You’ll learn: SQL SQL is essential for retrieving and managing data stored in databases. Topics include: Python Python is among the most popular programming languages for data analytics. You’ll learn: Power BI Power BI enables professionals to create interactive business dashboards. Skills include: Tableau Tableau is a leading visualization platform used by businesses worldwide. Students learn: Statistics Strong statistical knowledge helps analysts interpret data correctly. Topics include: Who Should Join a Data Analytics Course? A Data Analytics Course is suitable for: No prior coding experience is required for beginner-level programs. Career Opportunities After Data Analytics Training After completing a professional certification, you can apply for roles such as: The demand for these roles continues to grow across sectors. Salary of Data Analysts in India Salary depends on skills, certifications, experience, and location. Approximate salary ranges: Experience Average Annual Salary Fresher ₹3.5 – ₹6 LPA 2–4 Years ₹6 – ₹10 LPA 5–8 Years ₹10 – ₹18 LPA Senior Analyst ₹18 – ₹30+ LPA Professionals skilled in Python, SQL, Power BI, and cloud analytics often command higher salaries. Features of the Best Data Analytics Course in Vadodara When choosing a training institute, ensure it offers: Industry-Oriented Curriculum The course should cover: Live Projects Practical learning is essential. Students should work on: Experienced Trainers Learn from professionals with real-world industry experience who can bridge the gap between theory and practice. Placement Assistance A good institute should provide: Flexible Learning Options Choose between: How to Choose the Best Data Analytics Institute in Vadodara Before enrolling, evaluate these factors: Investing time in selecting the right institute can significantly impact your career growth. Why Hands-On Projects Matter Employers value practical experience as much as theoretical knowledge. Working on real datasets helps you: Projects also make your resume stand out in a competitive job market. Frequently Asked Questions Is coding mandatory for Data Analytics? No. Beginners can start with Excel and SQL. Python is introduced gradually, making it accessible even without a programming background. How long does a Data Analytics Course take? Most comprehensive courses range from 3 to 6 months, depending on the curriculum and learning mode. Can non-IT students learn Data Analytics? Yes. Students from Commerce, Arts, Science, Engineering, and Management backgrounds can successfully transition into Data Analytics with proper training. Which tools are most important? The core tools include: These are widely used across industries. Is Data Analytics a good career in 2026 and beyond? Absolutely. As businesses continue to embrace digital transformation and data-driven decision-making, the demand for skilled Data Analysts is expected to remain strong across sectors. Final Thoughts Data Analytics is no longer just a technical skill—it’s a strategic capability that powers innovation, efficiency, and smarter decision-making in virtually every industry. For students, professionals, and entrepreneurs in Vadodara, gaining expertise in analytics can unlock exciting career opportunities and provide a competitive advantage in the job market. When selecting a Data Analytics Course in Vadodara, prioritize institutes that emphasize practical learning, real-world projects, mentorship from experienced professionals, and career support. A well-rounded program should equip you with essential tools like Excel, SQL, Python, Power BI, Tableau, and statistics while helping you build a portfolio that demonstrates your capabilities. The right training can do more than prepare you for your first job—it can lay the foundation for a long-term career in business intelligence, data visualization, analytics consulting, or even data science. As organizations increasingly rely on data to shape strategy, professionals with strong analytical skills will continue to be in high demand. Whether you’re starting your career, looking to upskill, or planning a career transition, now is an excellent time to invest in data analytics and become part of one of the fastest-growing professions in the digital economy.

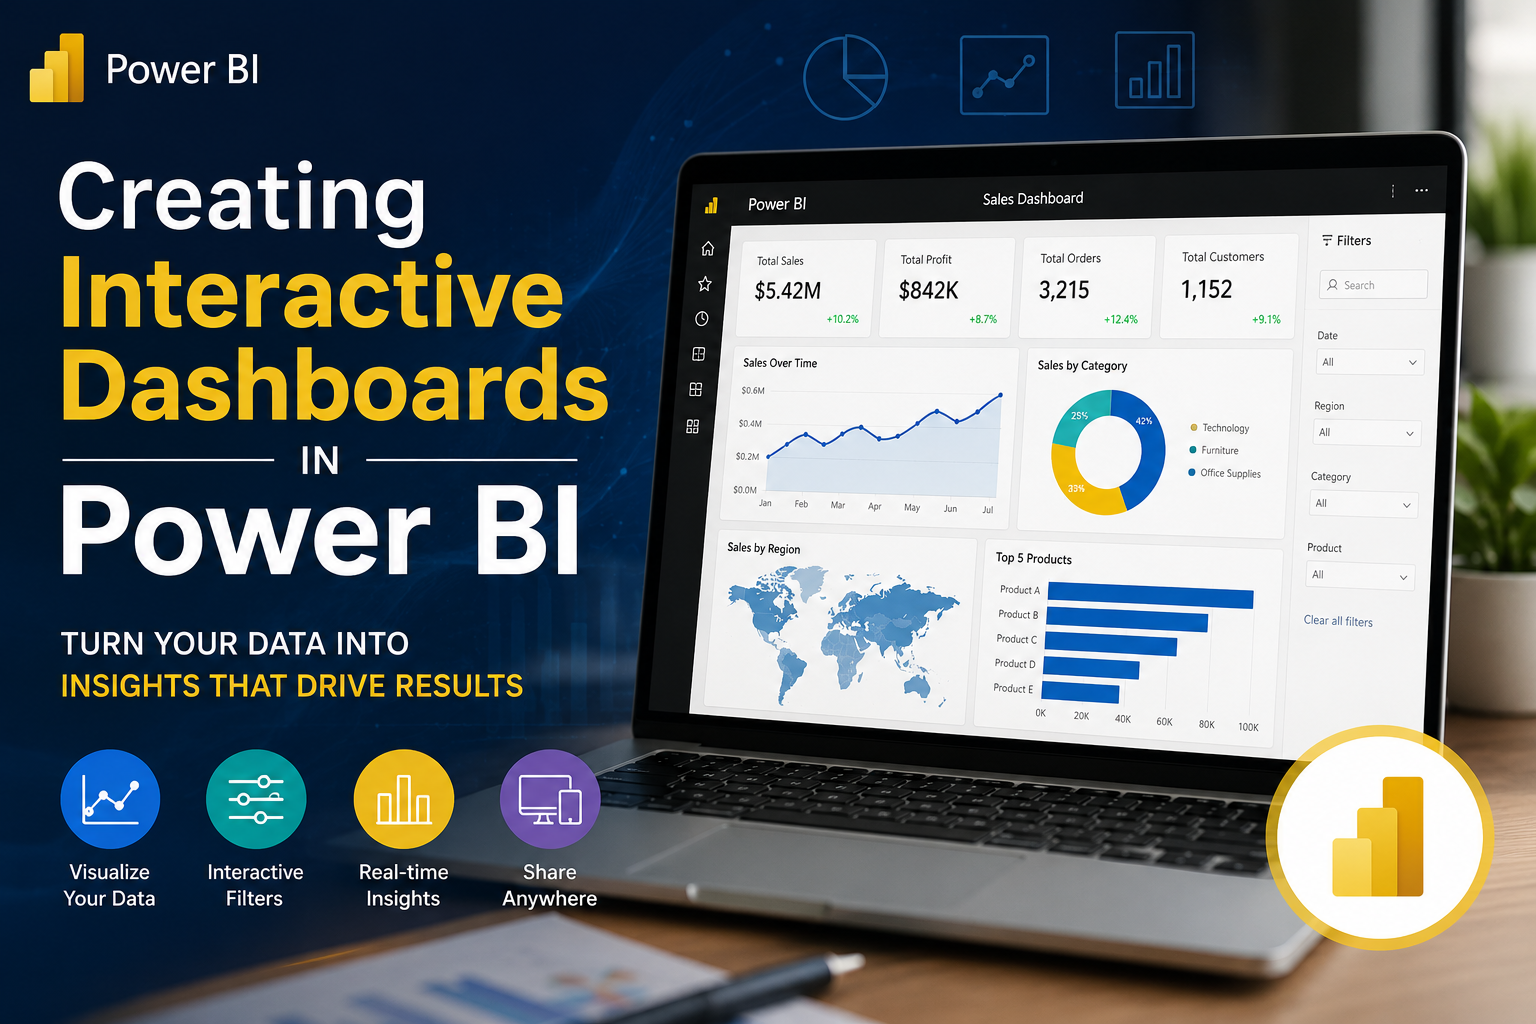
Creating Interactive Dashboards IN Power BI

While Excel is fantastic for quick data manipulation and prototyping, Microsoft Power BI is the industry standard for enterprise-grade, interactive data storytelling. It can easily handle millions of rows, connect directly to cloud databases, and auto-refresh reports in real time. Building a Power BI dashboard requires a structured, end-to-end framework often called the Data Pipeline lifecycle. Here is the step-by-step process to build a high-performing interactive dashboard. The 4-Step Power BI Architecture Step-by-Step Dashboard Build Step 1: Get & Transform Data (Power Query) Before you drop charts onto your canvas, you must ensure your data is clean and uniform. 1. Click Get Data in Power BI Desktop and select your source (SQL Database, Excel, Web, CSV, etc.). 2. Click Transform Data to open the Power Query Editor. 3. Perform standard data hygeine: Fix Data Types: Ensure date columns are formatted as `Date`, and monetary values are `Fixed Decimal Number`. Remove Nulls/Duplicates: Clean out empty rows or corrupted records. Unpivot Columns: Transform wide tables (e.g., columns for Jan, Feb, Mar) into long, narrow analytical tables for faster processing. Step 2: Establish the Semantic Model (Data Modeling) A common mistake beginner make is dumping everything into one giant flat spreadsheet. For complex, responsive dashboards, map your data into a Star Schema layout within the Model View: Fact Tables: Your central transaction table containing numeric values and metrics (e.g., `Fact_Sales` with Revenue, Quantity, OrderDate). Dimension Tables: Surrounding lookup tables containing descriptive attributes (e.g., `Dim_Customers`, `Dim_Products`, `Dim_Geography`). Relationships: Create 1-to-Many (`1:*`) relationships** linking unique IDs from your Dimension tables to the matching keys in your Fact table. Ensure cross-filter directions are set to single for optimal speed. Step 3: Write Key Metrics (DAX Fundamentals) Do not drag raw numeric columns directly onto charts. Instead, build explicit calculations using DAX (Data Analysis Expressions). Create a dedicated table to house your measures, and start with core business metrics: Total Revenue: “`dax Total Revenue = SUM(Fact_Sales[Revenue Amount]) Year-Over-Year (YoY) Growth: “`dax YoY Revenue Growth = VAR CurrentYearSales = [Total Revenue] VAR LastYearSales = CALCULATE([Total Revenue], SAMEPERIODLASTYEAR(‘Dim_Date'[Date])) RETURN DIVIDE(CurrentYearSales – LastYearSales, LastYearSales, 0) Step 4: Build the Visual Interface Switch to the Report View to begin designing your user experience. 1. Set Up the Canvas Background: Choose a professional layout. You can use a very light grey background (`#F3F4F6`) with crisp white visual containers to help charts pop cleanly. 2. KPI Headline Cards: Place standard card visuals across the top of your report to show key summaries (`Total Revenue`, `Profit Margin`, `Total Active Users`). 3. Choose the Right Core Visuals: Time-Series Analysis: Use a Line Chart to map trend variations over months or quarters. Categorical Breakdowns: Use a Clustered Bar Chart to evaluate product categories or regional performance. Contribution Analysis: Use a Matrix Visual for a structured drill-down look at financial numbers. Engineering Advanced Interactivity Power BI shines brightest through its native slice-and-dice interaction layers. Make sure to activate these three features to build a dynamic app-like experience: 1. Cross-Filtering and Highlights By default, clicking on a specific data segment in one chart (e.g., selecting “Electronics” on a bar chart) will automatically highlight or filter all other charts on the page. Pro-Tip: If you want a specific chart to remain unchanged when filters are clicked, go to the Format tab, click Edit Interactions, and select the None icon on that visual. 2. Drill-Through Actions Instead of cluttering a single screen with details, let users deep-dive into specifics. Create a secondary, detailed page (e.g., *Customer Deep Dive*). Drag the `Customer Name` field into the **Drill-through filters** well on that second page. Now, users can right-click any customer name on the main dashboard and instantly jump to that person’s detailed transaction history. 3. Tooltip Canvas Overlays Standard tooltips display basic numbers when a user hovers over a chart element. Power BI allows you to design an entirely separate miniature page and use it as a custom hover card. Hovering over a regional map, for example, can trigger a mini tooltip line graph showing that specific region’s 12-month sales trajectory. The Pro Dashboard Checklist Keep Slicers Collapsible: Use the Bookmarks and Selection Pane to build a slide-out filter panel. This keeps your canvas clean and maximizes real estate for your core charts. The 5-Second Test: A stakeholder should look at your dashboard and understand the top core business insight within 5 seconds without scrolling. Limit Color Variance: Use a single cohesive brand theme. Use neutral tones for 90% of the dashboard elements, reserving a vibrant action color (like navy blue or teal) exclusively to draw eyes to critical anomalies or targets.

Best IT Courses for School Students to Start Early Career

In today’s fast-changing digital world, learning IT skills at an early age can give students a strong advantage. School students who start learning technology early develop better problem-solving skills, creativity, and confidence. If you are looking for the best IT courses for school students, starting with the right courses can shape a successful future in technology. Why Should School Students Learn IT Skills Early? Learning IT skills is no longer optional—it’s essential. Key Benefits: Improves logical thinking Builds computer knowledge Prepares for future careers Increases confidence in studies Opens global career opportunities Top IT Courses for School Students Here are the most useful and beginner-friendly IT courses students can start with: 1. Python Programming Python is one of the easiest programming languages and perfect for beginners. 🔹 What Students Learn: Basics of coding Logic building Simple projects 🔹 Why Choose Python? Easy to understand Used in AI, Data Science, and Web Development High demand skill C Programming C programming helps students build strong coding fundamentals. 🔹 Benefits: Strong logic development Understanding of how programming works Base for advanced languages C++ Programming C++ is an advanced language used in software and game development. 🔹 What Students Learn: Object-Oriented Programming Advanced coding concepts Real-world applications Basic Computer Courses Before coding, students should understand computer basics. 🔹 Topics Covered: MS Office (Word, Excel, PowerPoint) Internet usage Basic computer operations Web Development (Beginner Level) Students can also start learning how websites are created. 🔹 Skills Covered: HTML & CSS basics Website structure Designing simple web pages Introduction to AI & Future Technologies Early exposure to AI helps students understand future career paths. 🔹 Topics: Basics of Artificial Intelligence Real-world AI applications Intro to automation Why Choose KS Technologies? If you are searching for the best IT training institute for school students, KS Technologies offers beginner-friendly courses designed for early learners. 👉 Explore Courses: https://www.kstechnologies.co/ 🌟 Key Features: ✅ Simple and easy teaching methods ✅ Practical learning approach ✅ Experienced trainers ✅ Certification after course completion ✅ Courses designed for beginners How to Choose the Right Course? Here’s a simple guide: Beginner: Start with Basic Computer + Python Intermediate: Move to C Programming Advanced: Learn C++ or Web Development Career Opportunities After Learning IT Skills Starting early opens many career paths in the future: Software Developer Web Developer Data Analyst AI Engineer Game Developer Final Thoughts The earlier students start learning IT skills, the better their future opportunities. Whether it’s coding, web development, or basic computer knowledge, every skill adds value. If you want to give your child a strong start in technology, enrolling in the right course at the right time is the key. Get Started Today Start your IT journey with expert guidance and practical learning. 👉 Visit: https://www.kstechnologies.co/ 👉 Enroll in beginner-friendly IT courses today

Start Coding After 12th: Beginner-Friendly Courses in Python, C & C++

Coding Courses for Beginners After 12th (Python, C, C++) After completing 12th, many students look for career options that offer high growth, good salary, and future stability. One of the best choices today is learning coding. Coding is the foundation of all modern technology—from mobile apps to websites and artificial intelligence. If you are a beginner, starting with the right programming languages like Python, C, and C++ can build a strong base for your IT career. Why Learn Coding After 12th? Starting coding early gives you a big advantage in your career. Key Benefits: High demand in IT industry Better job opportunities Improves logical thinking Global career scope Early career start Python Programming – Best for Beginners Python is one of the easiest programming languages and perfect for students starting their coding journey. 👉 Explore Course: https://www.kstechnologies.co/python-certificate-course-vadodara/ 🔹 What You Will Learn: Basics of programming Variables, loops, and functions Simple projects and applications Introduction to AI and Data Science 🔹 Why Choose Python? Easy syntax for beginners Widely used in AI, Data Science & Web Development High demand in job market C Programming – Build Strong Logic C programming is the foundation of many modern programming languages. 🔹 Benefits of Learning C: Strong logical thinking Understanding of core programming concepts Base for advanced coding languages C++ Programming – Step Towards Advanced Coding C++ is an advanced version of C and is widely used in software and game development. Explore Course: https://www.kstechnologies.co/c-plus-plus-programming-course-vadodara/ 🔹 What You Will Learn: Object-Oriented Programming (OOP) Classes and objects Advanced coding concepts Real-world applications 🔹 Why Learn C++? Used in software development and gaming Improves problem-solving skills Prepares for technical interviews Best Learning Path for Beginners If you are confused about where to start, follow this simple path: Step 1: Start with Python Step 2: Learn C for strong basics Step 3: Move to C++ for advanced skills 👉 This step-by-step approach helps you become a confident programmer. Why Choose KS Technologies? If you are looking for the best coding classes after 12th, KS Technologies offers industry-focused training programs. 👉 Visit: https://www.kstechnologies.co/ Key Features: Beginner-friendly teaching Practical hands-on training Experienced trainers Certification after course completion Career-oriented learning Career Opportunities After Learning Coding Learning coding opens many career options: Software Developer Web Developer App Developer Data Analyst AI & Machine Learning Engineer Final Thoughts Coding is one of the most valuable skills you can learn after 12th. Whether you start with Python, C, or C++, each language helps you build a strong foundation for a successful career in IT. If you want to stay ahead in the digital world, now is the perfect time to start learning coding.  Get Started Today Take your first step into the world of programming. 👉 Python Course: https://www.kstechnologies.co/python-certificate-course-vadodara/ 👉 C++ Course: https://www.kstechnologies.co/c-plus-plus-programming-course-vadodara/ 

How Data Analytics Drives Business Decisions Today

Impact of data analytics on modern businesses, from optimizing operations to enhancing customer experiences.

Why Web Development is a Great Career Choice in 2024

The high demand for web developers, potential career paths (front-end, back-end, full-stack), and the essential skills needed.

Top 5 Essential Skills for a Successful Data Science Career

Dive into the must-have skills for data science professionals, from mastering Python and machine learning to data visualization…